Overview
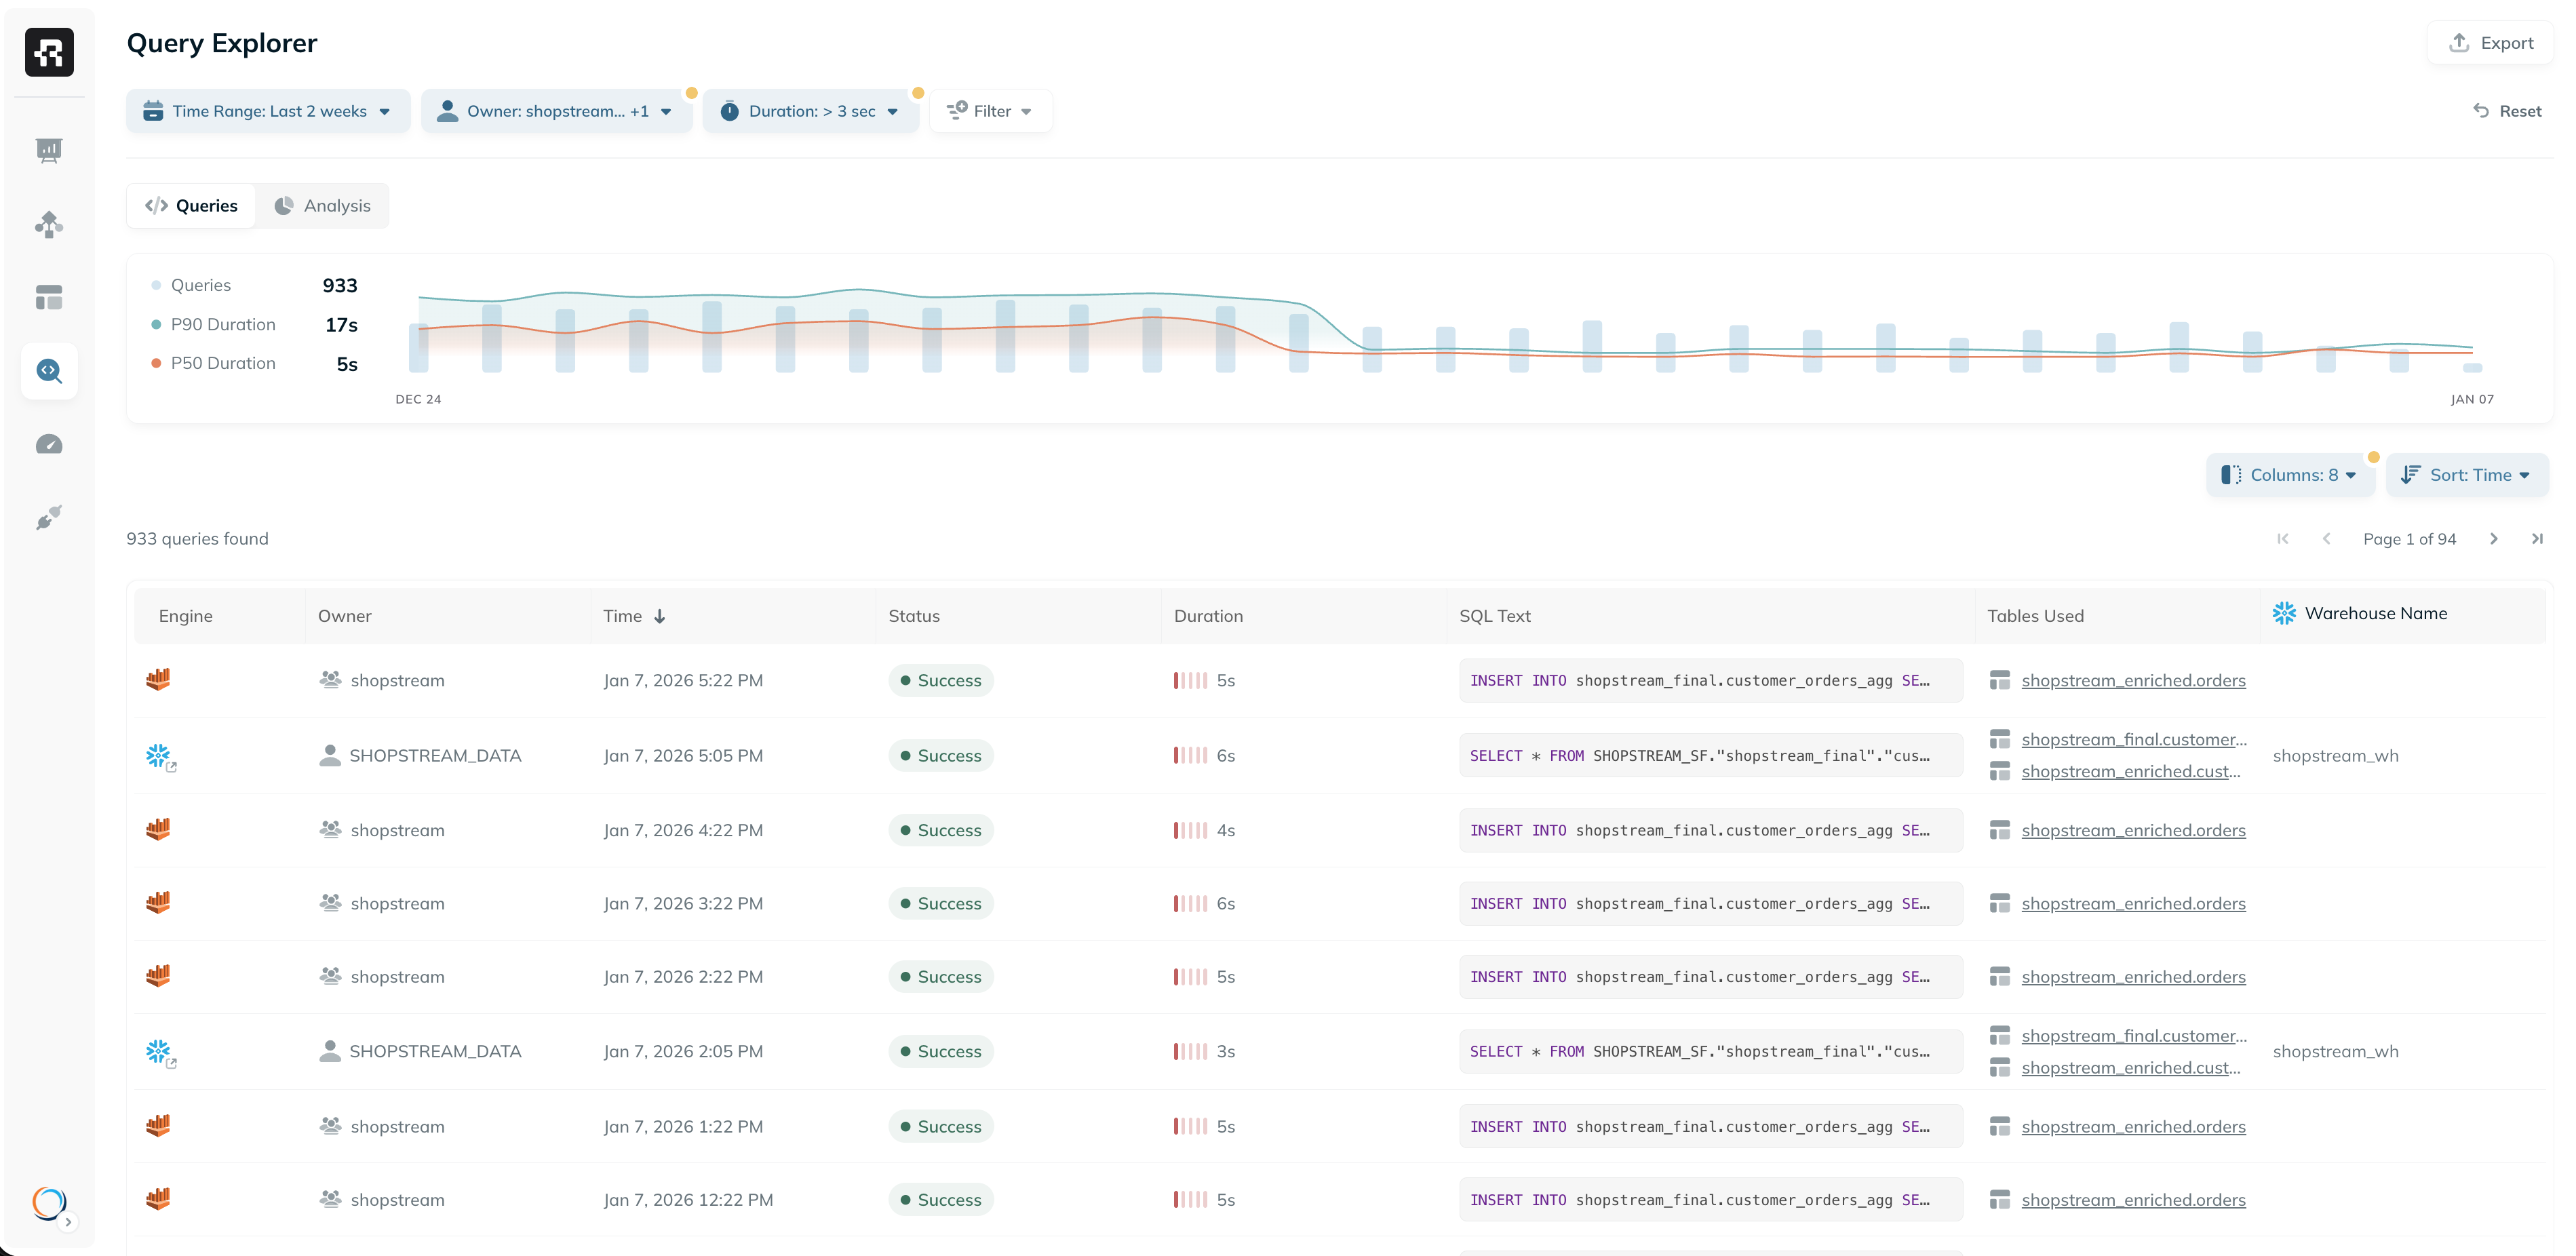
Ryft continuously collects and analyzes the query history from all engines connected to your lakehouse. This information powers Ryft’s intelligent optimization engine, allowing it to detect inefficiencies and optimize data layout based on your organization’s usage patterns. Queries are also visible in the Ryft platform, providing deep visibility into how data is accessed and used, and enabling your team to identify inefficiencies and optimize performance. Explore query activity and trends in the Query Explorer, or directly in the Queries tab of specific tables.Query Explorer
The Query Explorer provides visibility into every query executed across your lakehouse and query engines. It enables flexible filtering, sorting, and analysis capabilities for troubleshooting, performance tuning, and optimization. You can use the Query Explorer to:- Identify slow or expensive queries
- Analyze trends in usage across users, engines and tables
- Spot outliers or anomalies
- Audit data access and monitor governance
Columns & Filters
The Query Explorer supports dynamic filtering and sorting on many fields, allowing you to slice and dice your query history. You can filter and sort by:- Engine (e.g. Snowflake, Trino, Spark)
- Owner
- Status
- Query Duration
- Assets Referenced (tables/views mentioned explicitly in query text)
- Tables Used (resolved physical tables accessed)
- Columns Referenced
- Query Tags
- And many more…
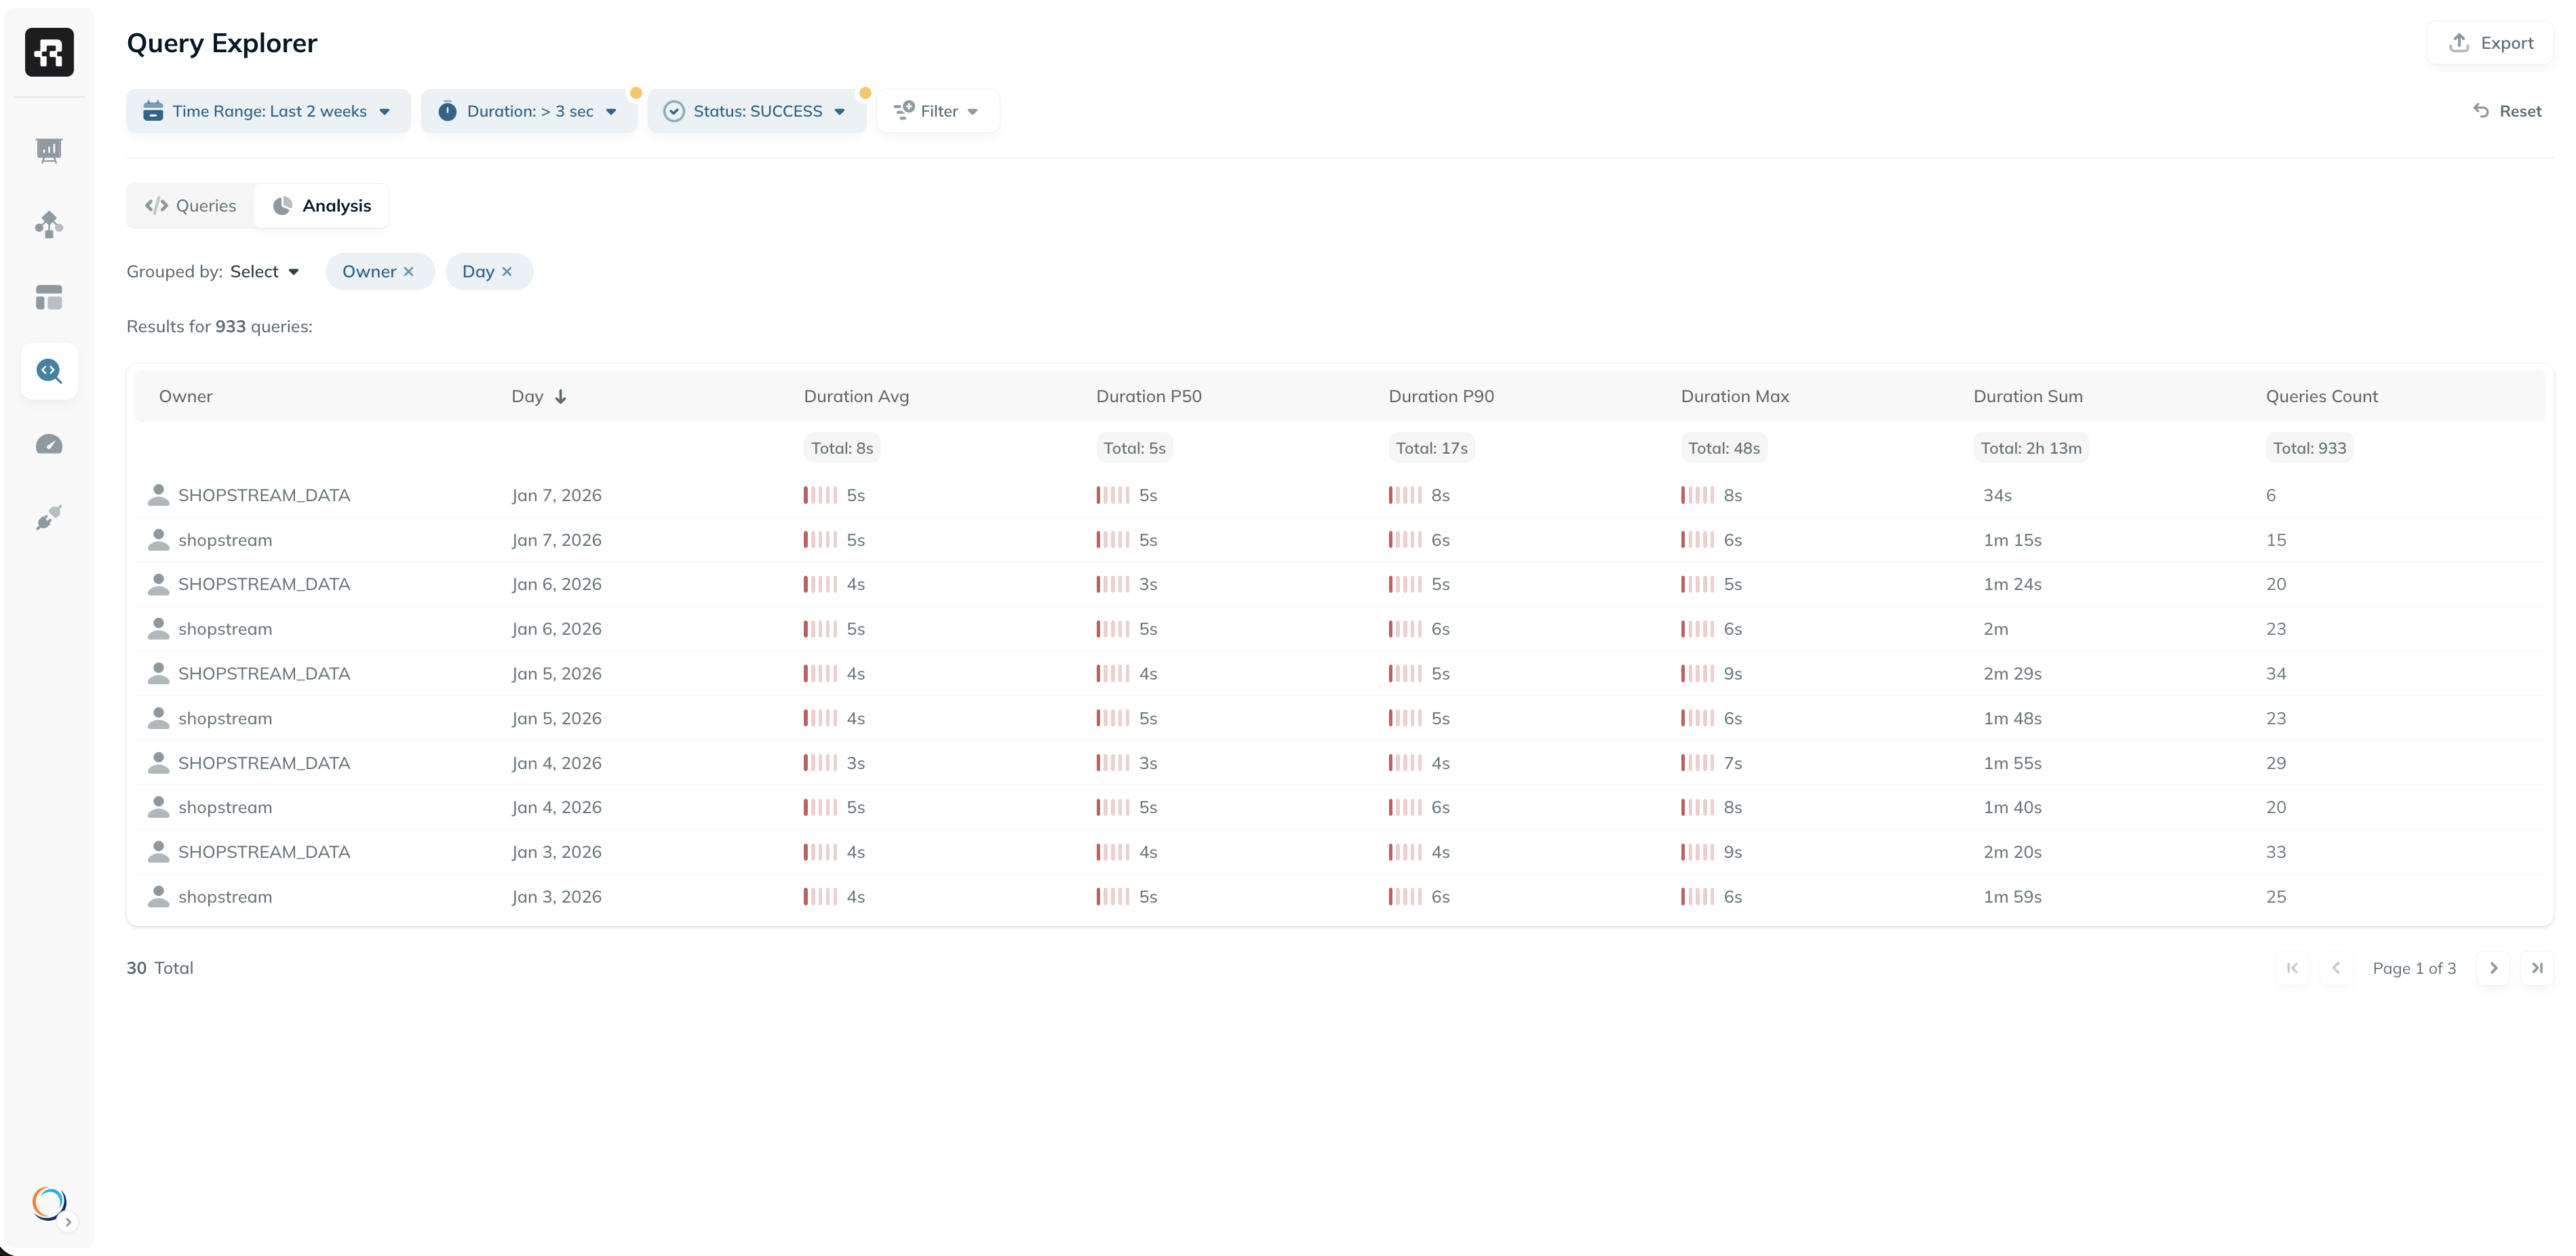
Analysis
The Analysis tab lets you go beyond the table view:- View aggregate stats like total queries, average duration, and total duration
- Group and pivot queries by dimensions like engine, user, team, day, or table
- Export pivot results for external analysis
Additional Capabilities
- Export - export filtered results to a CSV file. All exported values are unformatted for easier post-processing - durations in milliseconds, sizes in raw bytes, etc.
- Shareable URLs - the current view can be shared with team members simply by sending the current URL. All filters, columns and sorts are encoded in the URL.