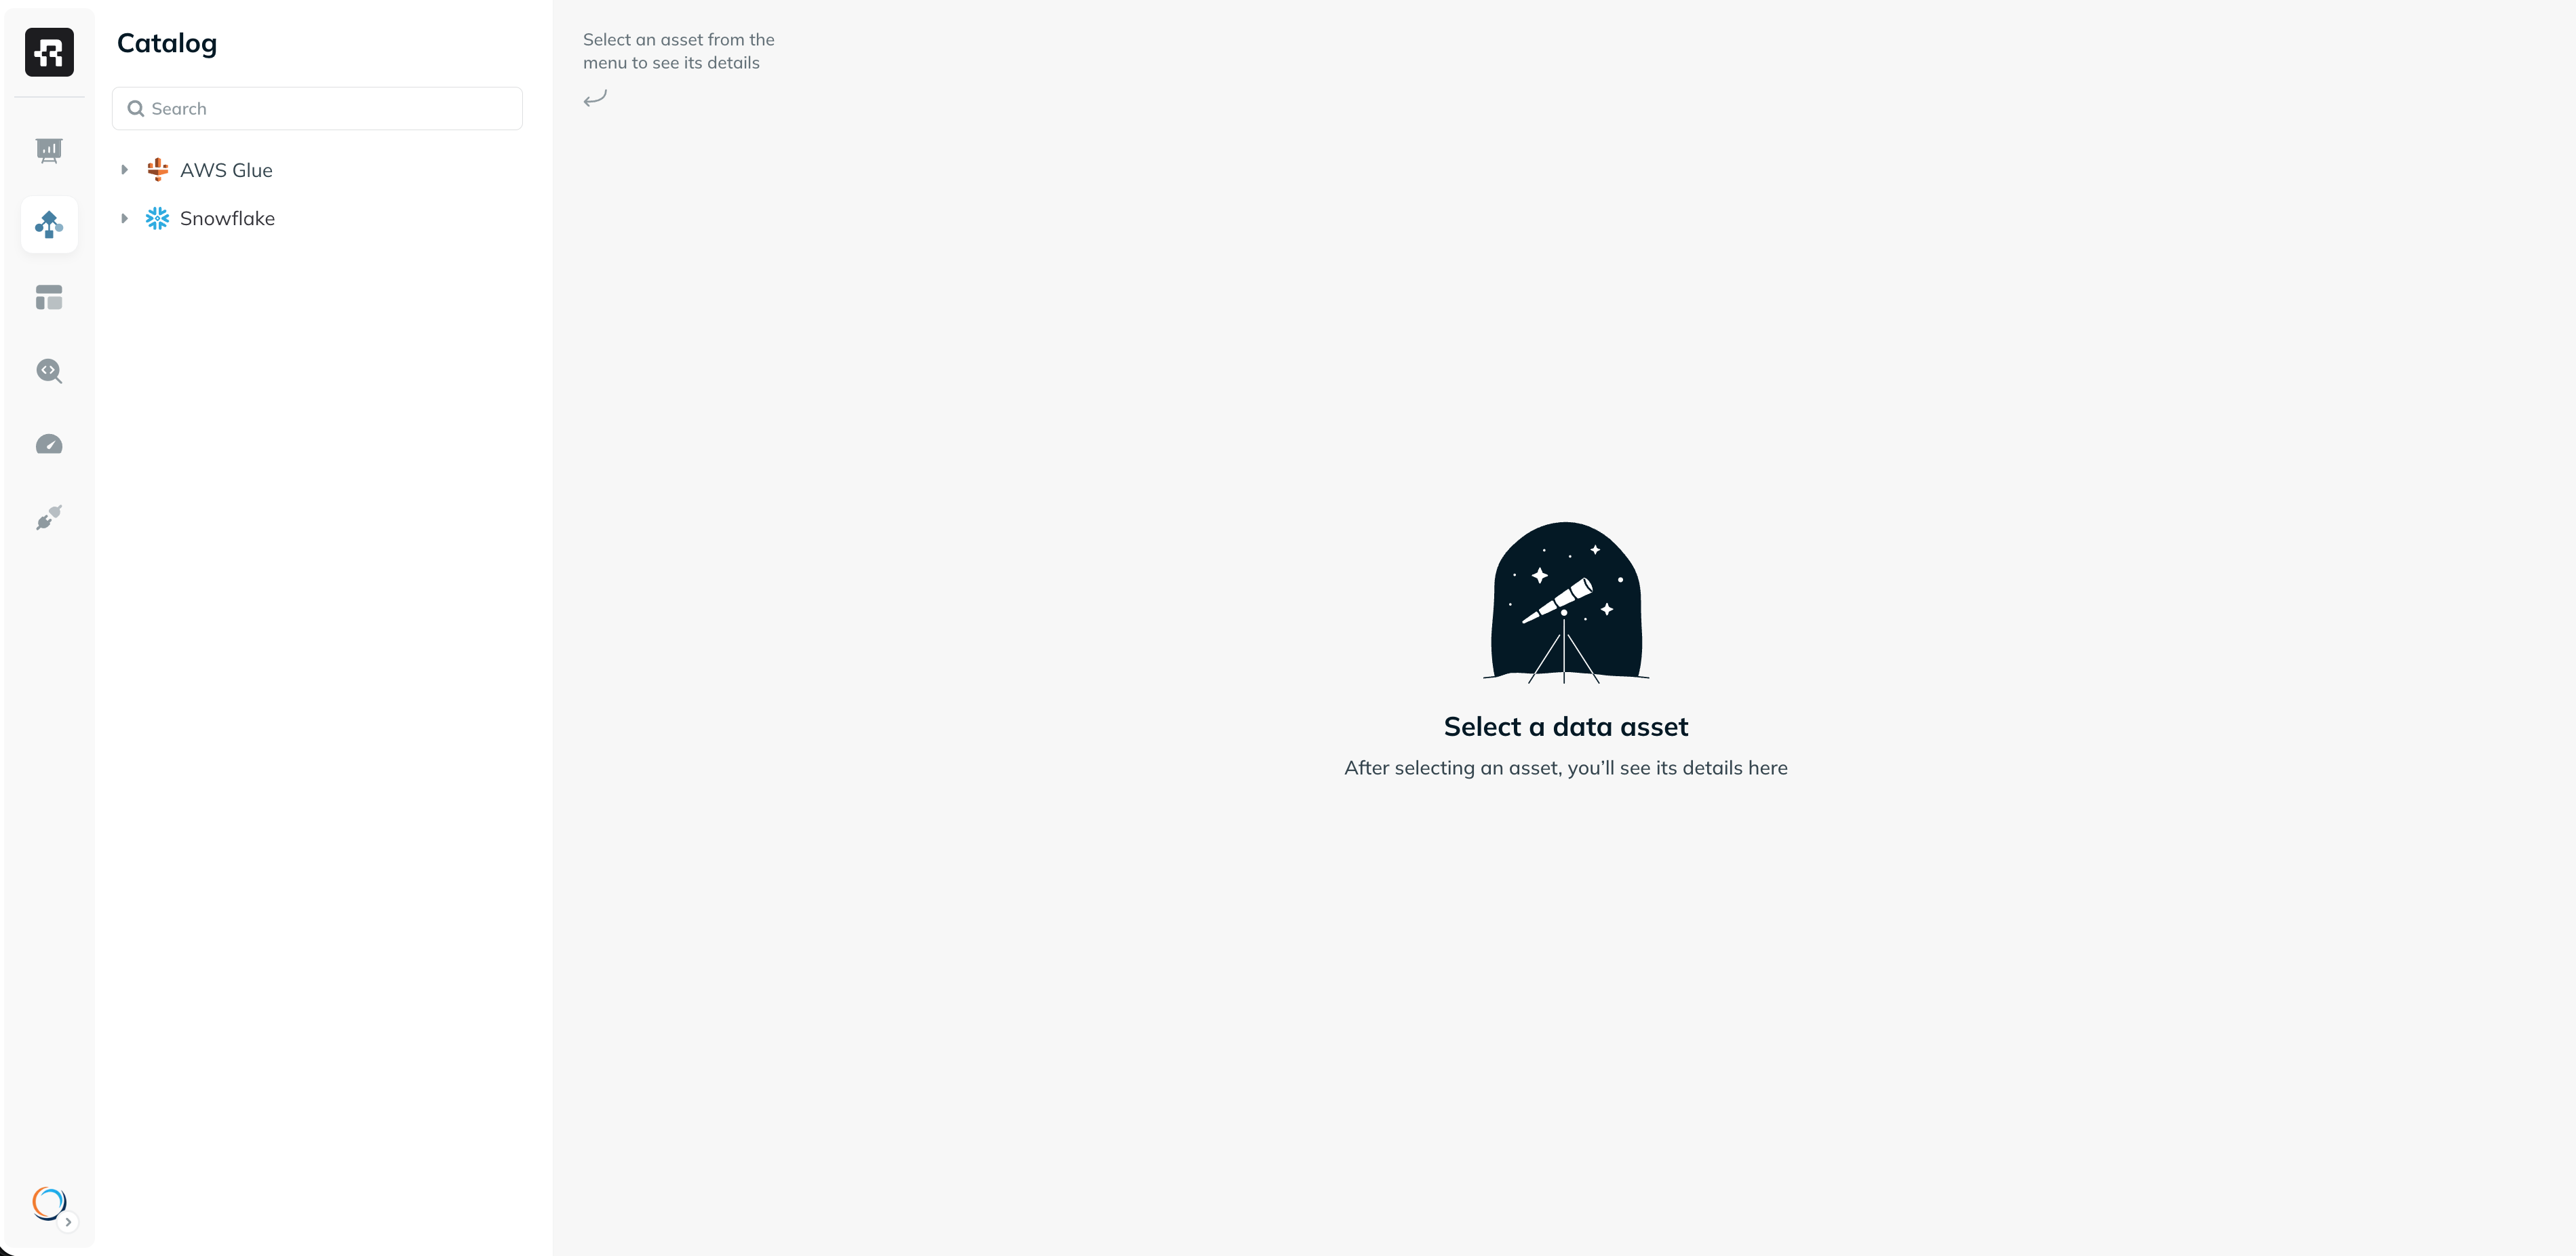
The Catalog page provides a centralized view of all data assets across your organization, including Iceberg tables and other types of tables and views from data warehouses. It allows teams to gain full visibility into their multi-engine lakehouse, making it easier to monitor and manage all of their assets in one place.Documentation Index
Fetch the complete documentation index at: https://docs.ryft.io/llms.txt
Use this file to discover all available pages before exploring further.
Key Features
- Catalog Browsing: View all available tables and views across the lakehouse, in one unified interface.
- Table Management: Configure management for individual tables, specific namespaces or entire catalogs - including data compaction, orphan file cleanup, data lifecycle and more. See more under Managed Tables.
- Asset Visibility: Access essential information for any asset, such as:
- Schema: Details on the columns, column types and column usage.
- Writes: Insights into how and when data is being written to the table.
- Storage: Visibility into table storage, which can be used to monitor infrastructure and utilization.
- Queries: View past queries executed on the asset and understand usage patterns.

Catalog Overview
For each Iceberg catalog, you can view catalog-level metrics that summarize the health, scale, and activity of all tables in that catalog. This provides a high-level operational view for platform teams and helps quickly identify hotspots, growth trends, and potential cost or performance issues. The catalog overview includes:- Total Storage: The total storage footprint of all tables in the catalog across all tracked snapshots.
- Active Storage: The portion of storage currently referenced by the latest snapshots. A low active storage ratio may indicate excessive historical data, unexpired snapshots, or suboptimal retention policies.
- Table Count: The number of tables in the catalog, including their growth over time.
- Write Activity: Aggregated write activity across all tables, highlighting ingestion-heavy catalogs.
Namespace Overview
The Namespace Overview provides a focused view of all tables within a specific namespace. This is useful for understanding how individual domains, teams, or projects are utilizing the lakehouse. At the namespace level, you can analyze:- Total Storage: The combined storage footprint of all tables in the namespace.
- Active Storage: The portion of storage actively referenced by current snapshots across tables in the namespace.
- Table Count: The number of tables in the namespace and how it changes over time.
- Write Activity: Aggregated write operations and ingestion volume for all tables in the namespace.
Table Overview
Each Iceberg table has its own page, providing valuable information to understand table behavior and usage. The table overview is designed for both day-to-day operations and deeper analysis. It combines metadata from Iceberg with engine-level metrics to help you understand how data is written, stored, queried, and maintained over time. From this page, you can also navigate to management features such as lifecycle policies, compaction, and cleanup.Storage
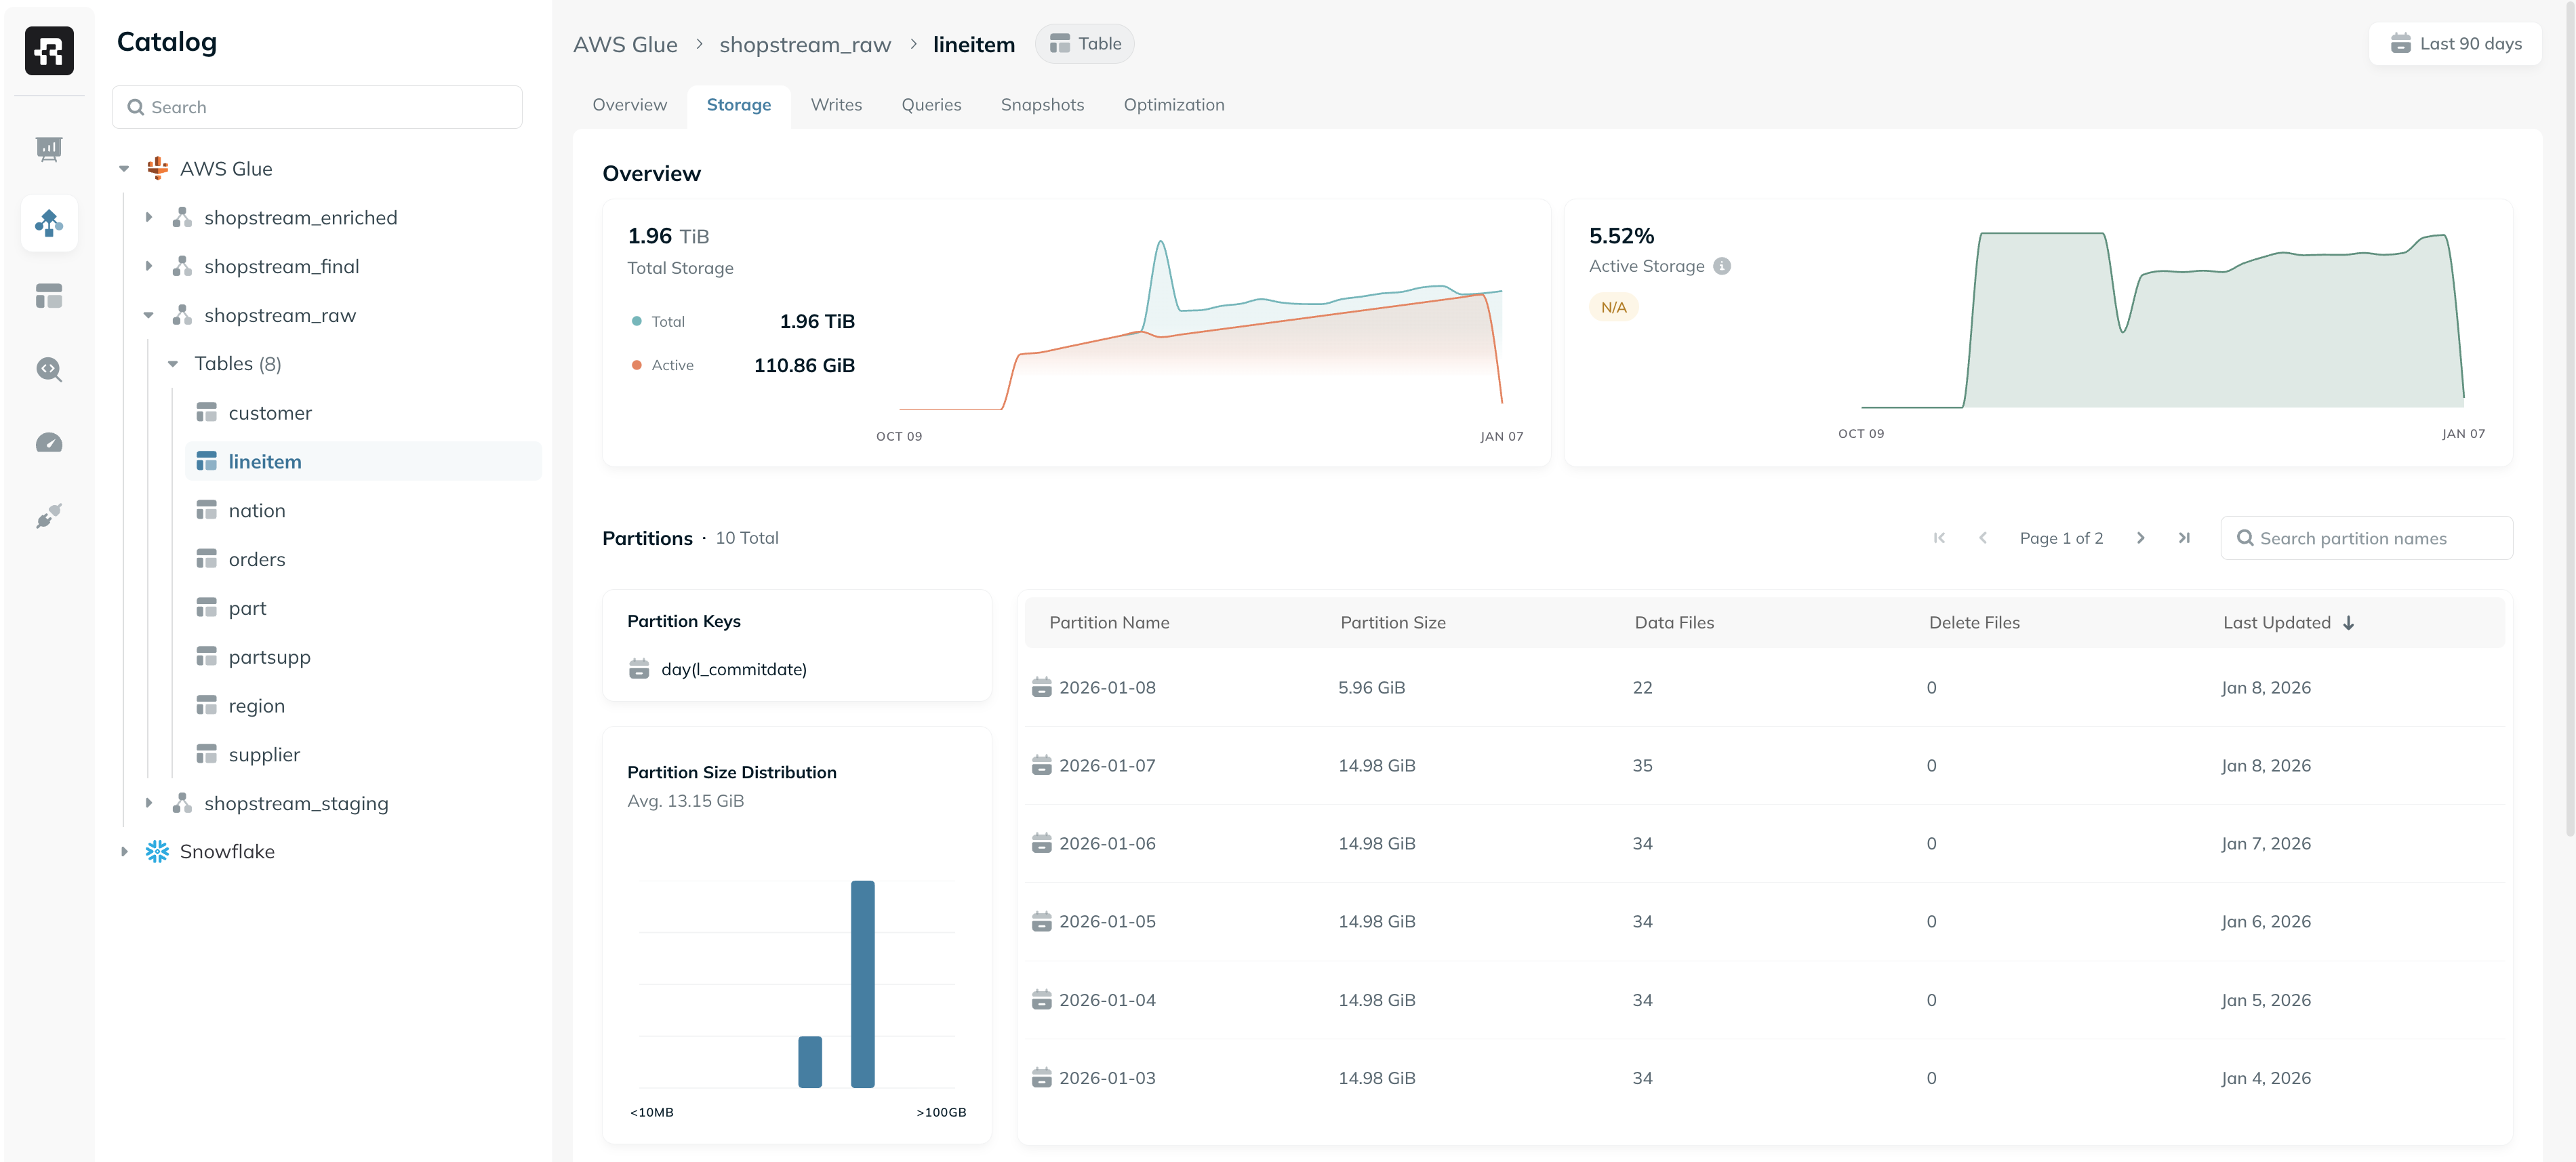
The Storage tab provides detailed insights into the physical layout and storage efficiency of a given Iceberg table. This includes analysis of data file sizes, partition distribution, and the breakdown of different file types. The following metrics and graphs are available to help understand how storage is used by the table and identify potential inefficiencies:- Total Storage: Shows the total storage footprint of the table over time. This includes all data files across all tracked snapshots.
- Active Storage: Displays the percentage of storage actively used by the current snapshot. Lower percentages may indicate data bloat or suboptimal snapshot retention configurations.
- File Size Distribution: Shows the distribution of data file sizes in the table. Since Iceberg performs best with optimally sized files, this chart helps detect issues such as small files or oversized files that can degrade performance.
- Partition Size Distribution: Shows the size distribution across partitions to identify partition skew, which can affect query performance and parallelism.
- Partitions Table: Displays information (file count, last updated, etc.) on all partitions in the table. This can be used to identify partitions with suboptimal sizes, analyze recently updated partitions, and more.
- Files: Breaks down the number and size of files by type - data files, metadata files, and delete files - providing visibility into the table’s storage structure and trends.

Writes
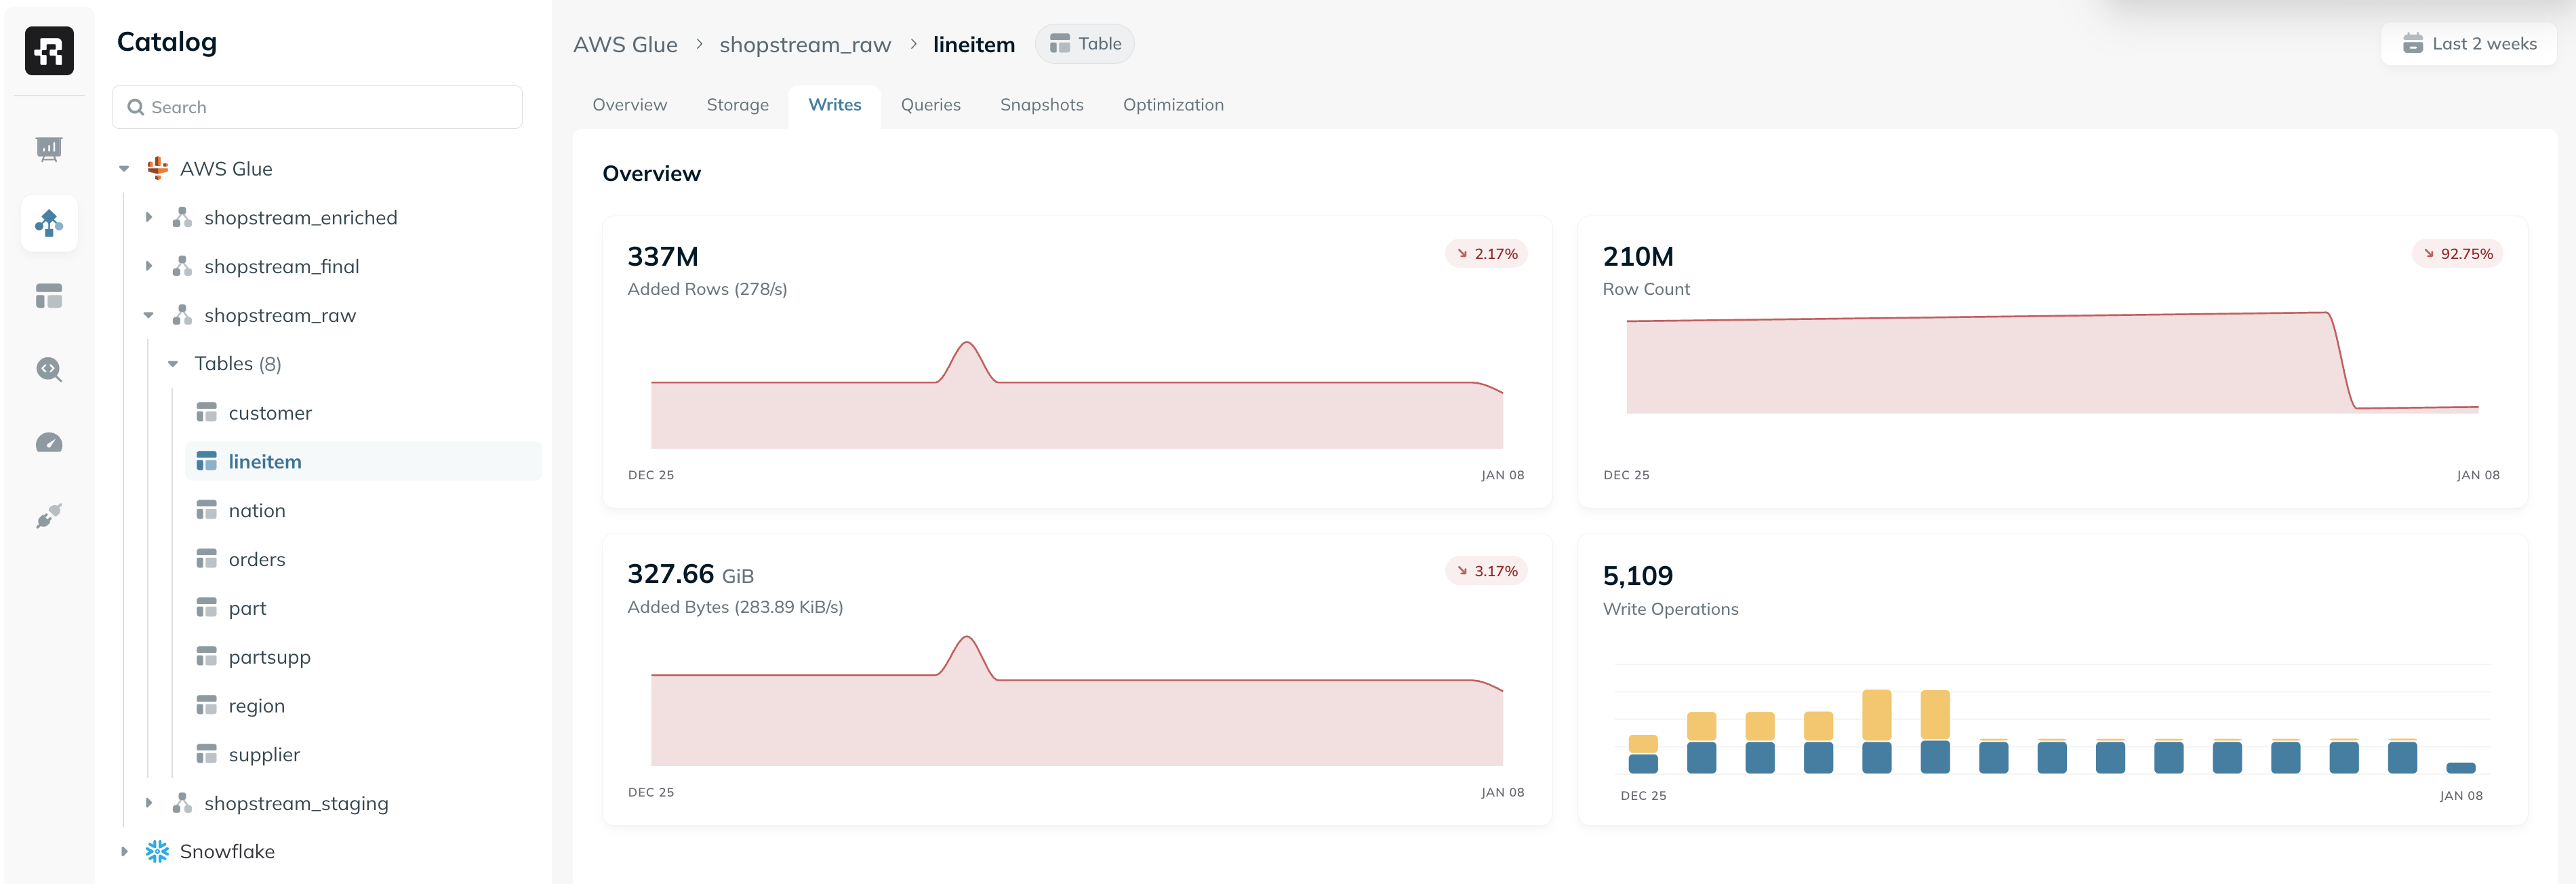
The Writes tab provides deep visibility into the write patterns for a given table. This includes details on the write operations, ingress rate, and ingestion pipeline. The information in this tab is based on Iceberg metadata, as well as metrics from Spark apps (when available).
- Added Rows: The total number of rows added to the table in the selected time range, and the average rate in which they’re added.
- Row Count: The total row count in the table and its growth over time.
- Added Bytes: The total number of bytes added to the table in the selected time range, and the average rate in which data is being ingested into the table.
- Write Operations: The amount of write operations (i.e. commits) to the table over time, and its breakdown to different Iceberg operation types.
Snapshots
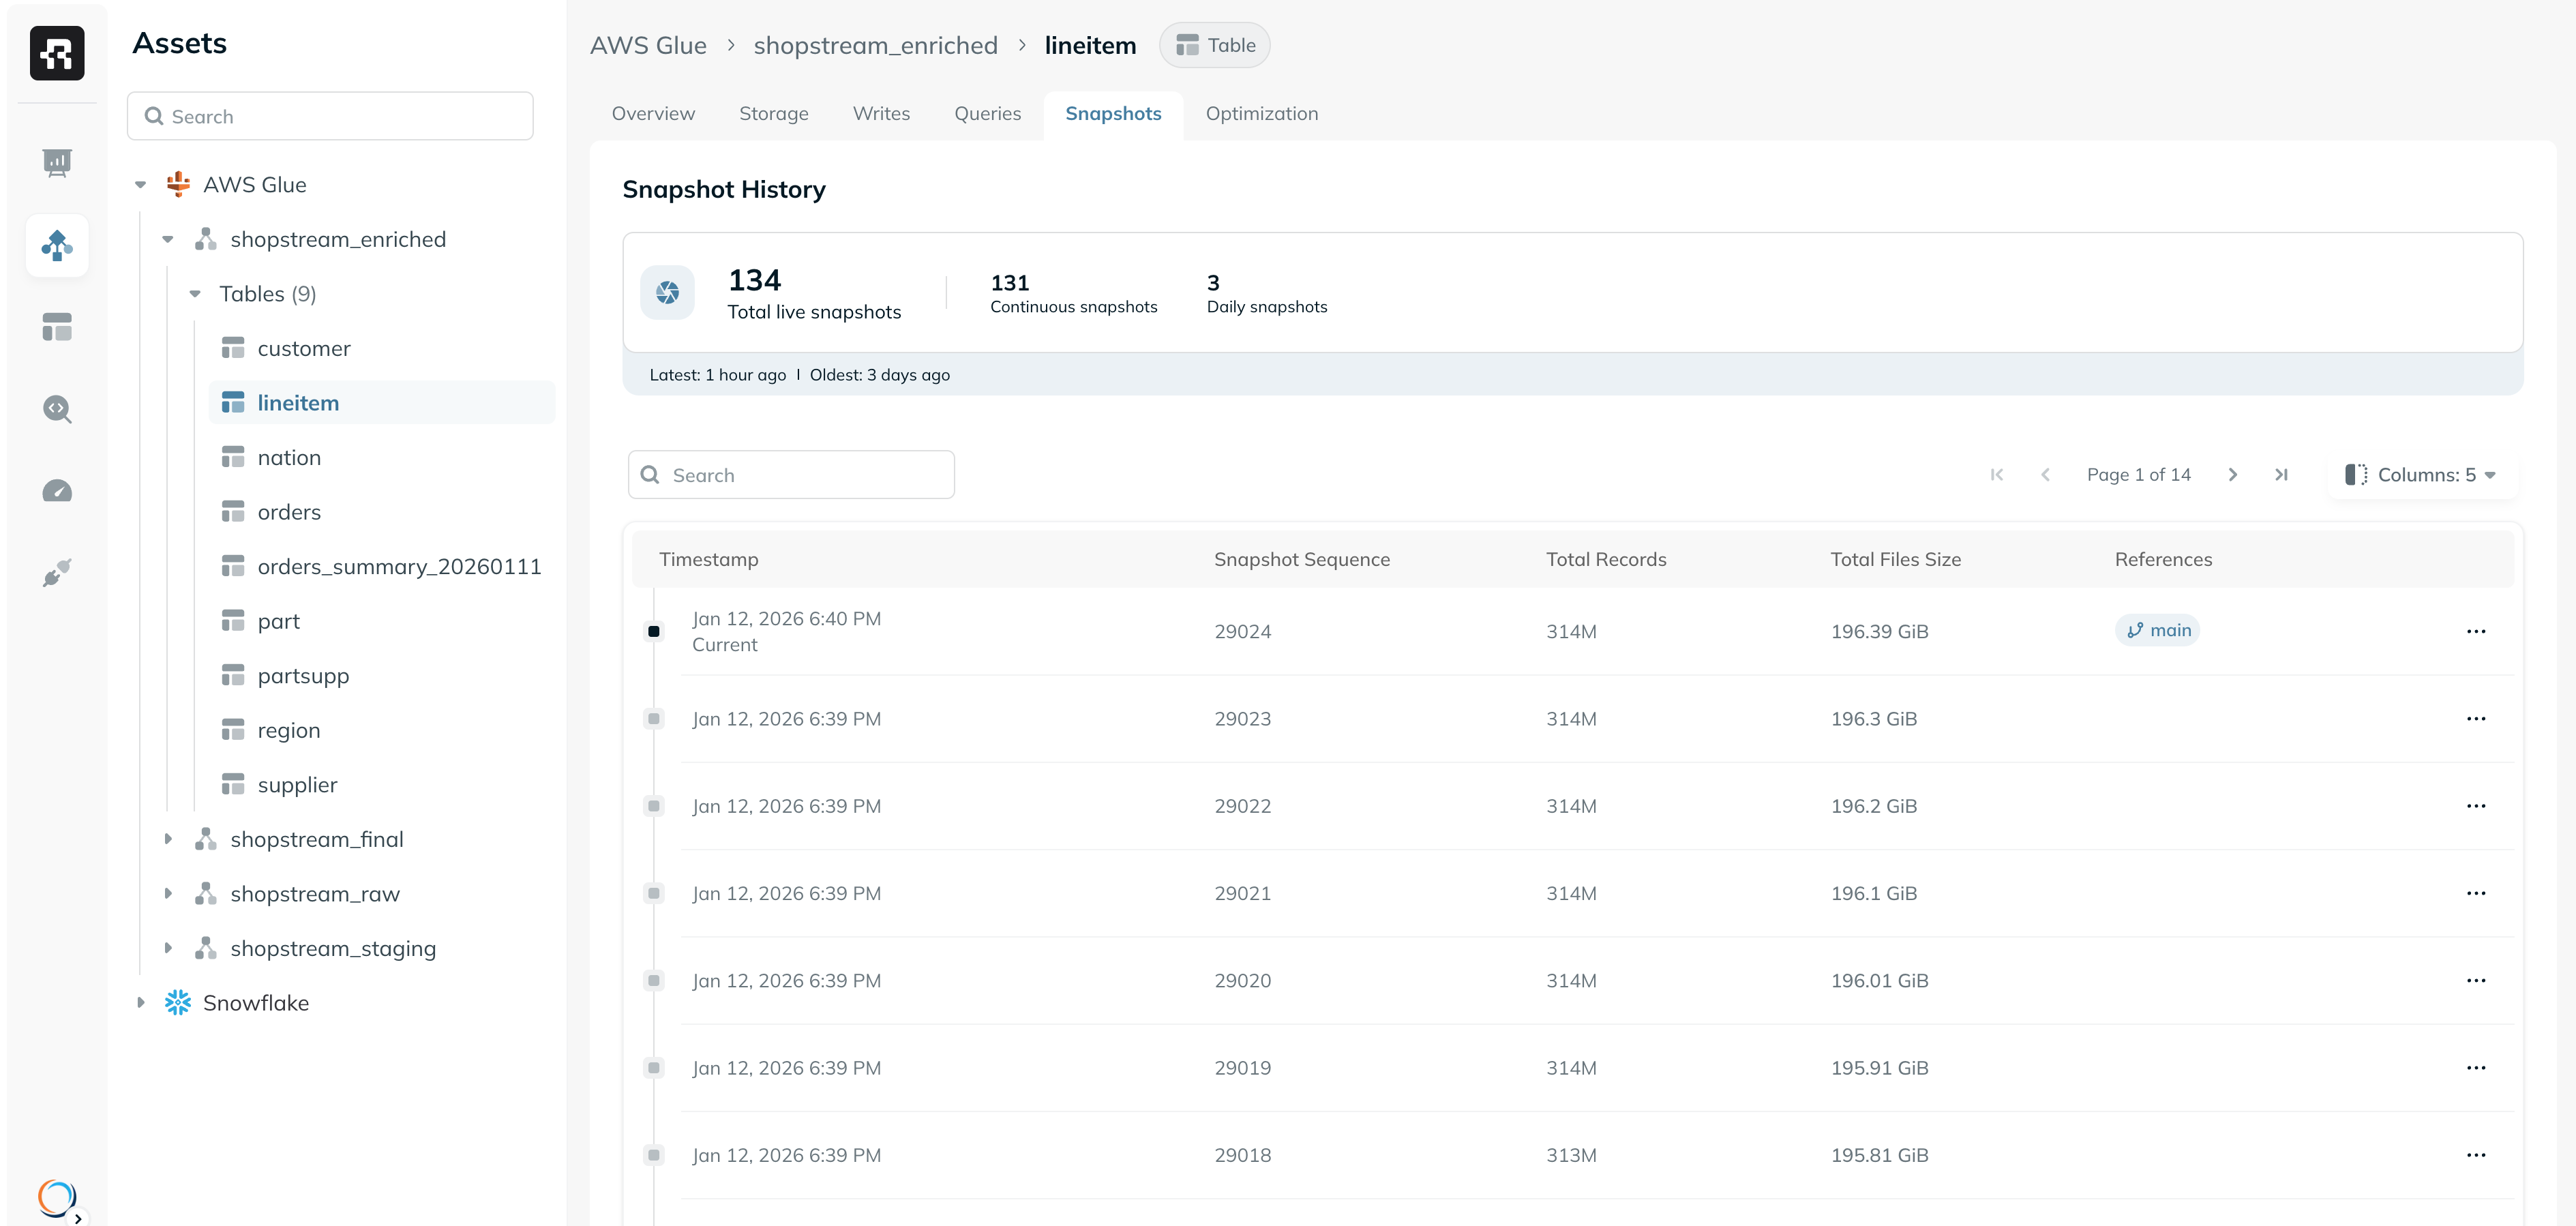
The Snapshots tab provides full visibility into the snapshot history of an Iceberg table. Each snapshot represents the complete state of the table at a specific point in time. This view can help you understand the full timeline of snapshot creation, identify changes between different snapshots, and analyze the status of the table in a specific point of time. You can use the column picker to view additional metrics for each snapshot, including the operation type, the amount of bytes added or removed in that snapshot, etc. For teams that use Iceberg tags or branches, these can be tracked in the “References” column. You can also view daily and weekly snapshots created as part of Snapshot Lifecycle.